📊 System Monitor
The System Monitor profile turns the DK-Quake screen into a system dashboard: system and GPU performance on the left, memory plus storage/network in the middle, GPU and power state on the right.
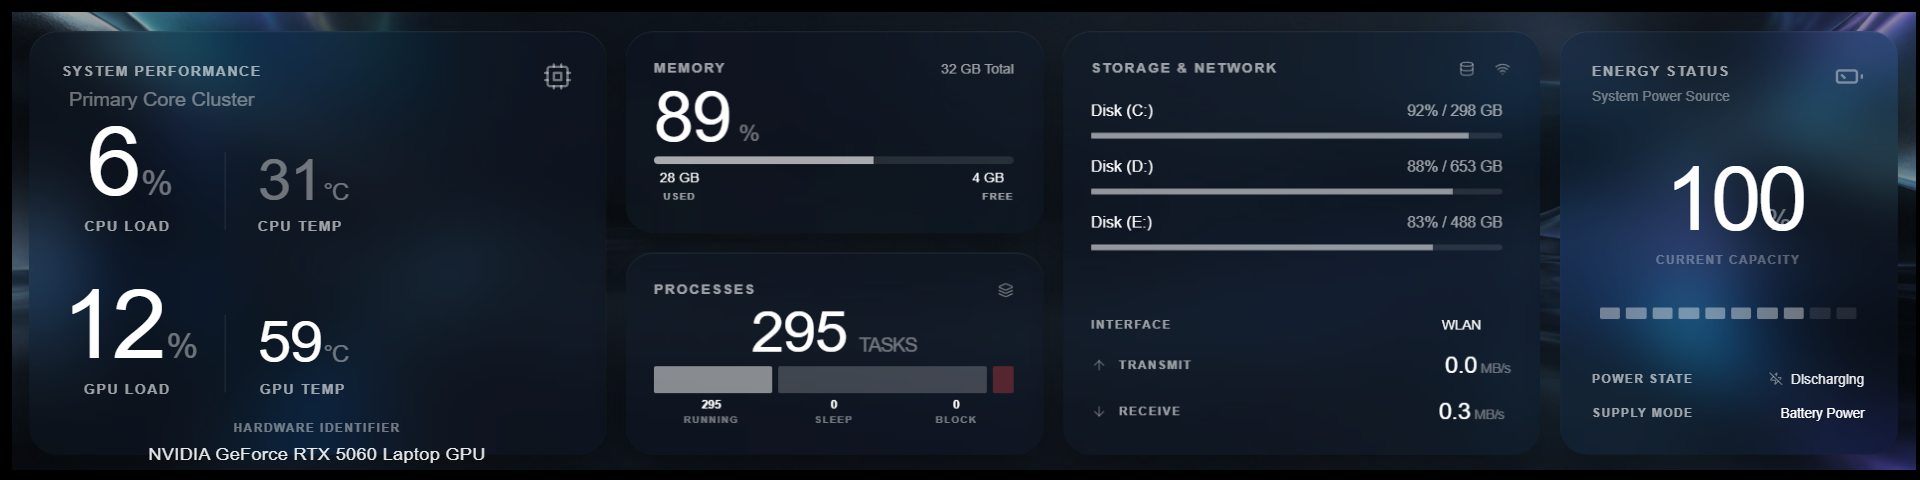
Captured on v0.4.95 (this machine: RTX 4070 / 32 GB / 284 tasks).
What's on screen
| Area | Content |
|---|---|
| System performance | CPU load %, CPU temperature, GPU load, GPU temperature, with the hardware badge underneath (e.g. NVIDIA GeForce RTX 4070) |
| Memory | Total / used / available with a large percentage (e.g. 32 GB total, 61% used) |
| Processes | Task count (e.g. 284 tasks) with running / sleeping / suspended bars |
| Storage & network | Disk usage per drive (C/D/E) plus WLAN up/down rates (e.g. 1.8 Mb/s ↑, 12.4 Mb/s ↓) |
| GPU / battery | Large percentage with GPU fans; power state, charging mode and battery |
TIP
Every number is collected live, so the hardware badge, core count and drive letters follow the machine DK-Suite runs on.
Bottom settings (click a card)
Clicking anywhere on the dashboard expands the panel settings below it:
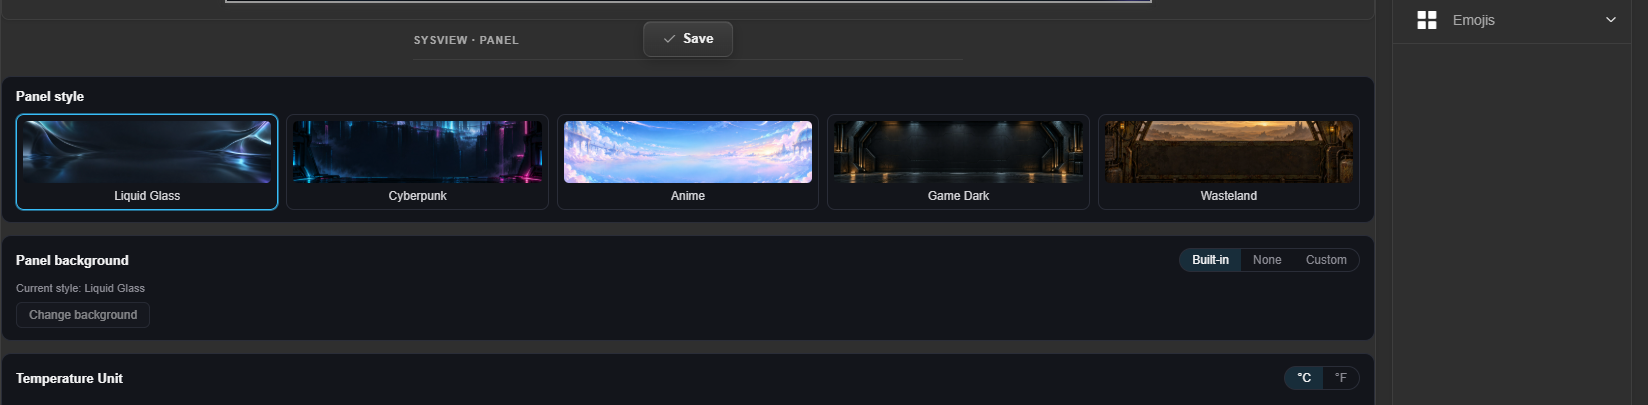
| Setting | Options |
|---|---|
| Panel style | 5 built-in themes: Apple Glass, Cyberpunk, Anime, Game Dark, Wasteland |
| Panel background | Styling built-in / No background / Custom (upload your own image) |
| Temperature unit | ℃ / ℉ (affects the CPU/GPU temperatures) |
Click Save to apply.